


Reseach conducted by BigOceanData for TradeWinds
The analysis is based on observations from BigOceanData’s global AIS vessel-tracking network, combining vessel positions collected across terrestrial and satellite sources.
Among the months sampled, traffic through Bab el-Mandeb was highest in July 2026, then fell 18% in August after the Houthis announced a blockade of Saudi shipping. Compared with October 2023, the fleet using the route is markedly older, ships have almost stopped declaring Saudi Red Sea ports, and protective AIS messaging has more than doubled among vessels that transited the strait in both January and August.
The analysis uses six month-long AIS extracts: October 2023, June 2024, and January, February, July and August 2026. It covers cargo and tanker vessels meeting our 10,000 DWT or 100m size filter; see the methodology below. All figures are AIS-visible observations from the BigOceanData network, not a total count of traffic.
Headline figures
| -18% | fall in observed transits between the July and August monthly averages; part of the July high was a short Hormuz diversion |
| 11.1 → 16.9 years | mean age of the transiting fleet, a step up in 2024 that has held since. Over-20s: 10.9% to 32.6% |
| 17.4% → 0.6% | of northbound transits declaring a Saudi Red Sea port, 1 to 19 July against August |
| 14.4% → 31.4% | of the same 153 ships broadcasting protective AIS messages, January to August. 32 started, 6 stopped |
Key numbers, six months at Bab el-Mandeb
| Oct 23 | Jun 24 | Jan 26 | Feb 26 | Jul 26 | Aug 26 | |
| Observed transits per day | 51.3 | 19.2 | 23.1 | 25.2 | 26.4 | 21.7 |
| Any protective message (%) | 19.4 | 41.2 | 14.9 | 19.4 | 31.6 | 32.0 |
| ↳ of which crew nationality or Israel denial | 0.0 | 27.3 | 8.4 | 9.3 | 20.2 | 22.1 |
| ↳ of which armed guards aboard | 19.4 | 17.1 | 7.0 | 10.6 | 14.8 | 11.8 |
| Northbound declaring a Saudi port (%) | 14.2 | 18.8 | 18.5 | 16.6 | 13.6 | 0.6 |
| Mean age of transiting fleet (years) | 11.1 | 15.8 | 17.0 | 16.3 | 15.7 | 16.9 |
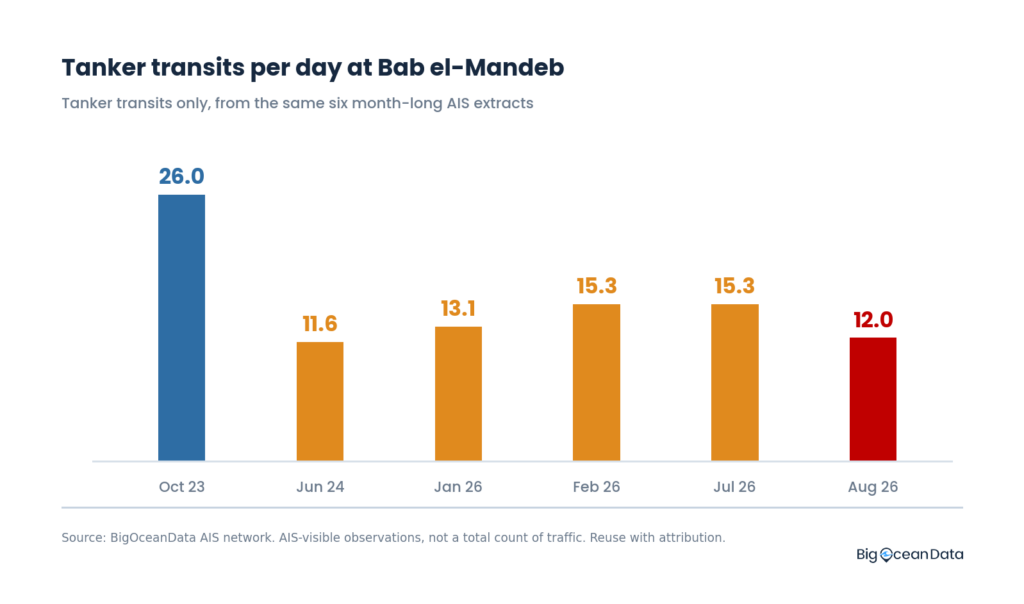
| Tanker transits per day | 26.0 | 11.6 | 13.1 | 15.3 | 15.3 | 12.0 |
Message rows are the share of vessels transiting that month broadcasting at least one message of that type. The two sub-rows overlap, so they sum to the total or more. Armed-guard notices predate the campaign, which is why that row starts high. Total observed transits across the six extracts: 5,081. All six months are drawn on identical geography.
Traffic recovered into July, then fell back
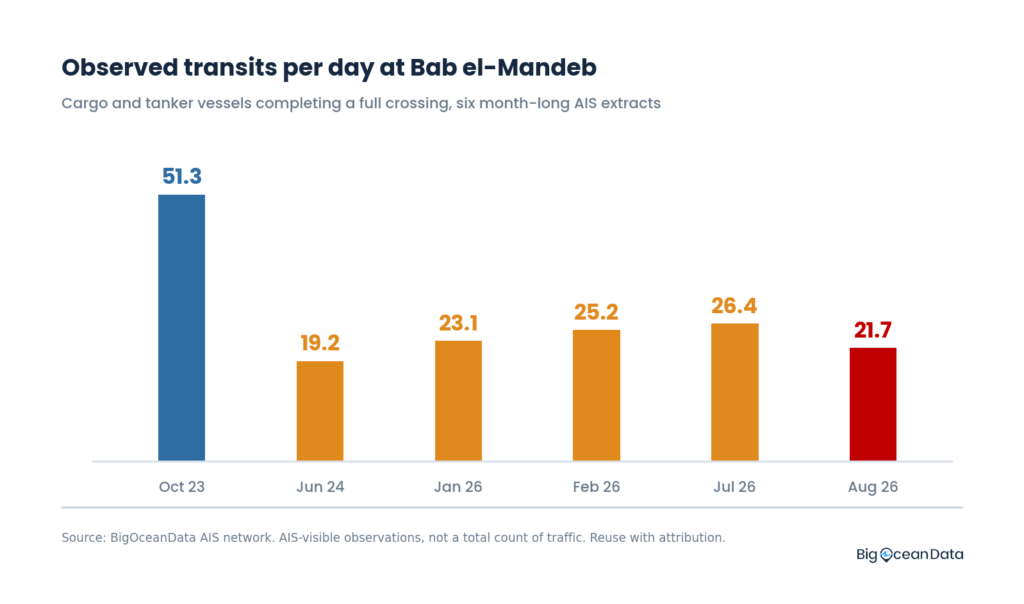
Our sampled months trace a recovery from the depth of the campaign. Observed transits run 51.3 a day in October 2023, 19.2 at the June 2024 trough, then 23.1 in January, 25.2 in February and 26.4 in July 2026, before August falls to 21.7. We sampled six months rather than every month, so July is the highest of our sampled 2026 months rather than a measured annual peak.
Observed transits per day. AIS-visible observations from the BigOceanData network.
The July figure is not evenly spread. Transits run 22.4 a day from 1 to 10 July, 32.8 a day from 11 to 19 July, and 24.9 a day after the blockade. That middle window is tanker-led: over 11 to 19 July, 20.6 tanker transits a day against roughly 13 either side, northbound tankers rising from 6.1 to 10.3 a day, and northbound vessels declaring a Saudi Red Sea port rising to 19.3% from 14.8%. February shows no comparable spike.
That is consistent with reporting elsewhere attributing an influx into Bab el-Mandeb over this period to constraints at the Strait of Hormuz, with Saudi Arabia using Yanbu as an alternative export route. Excluding those nine days, the rest of July runs at 23.8 transits a day, in line with January and February. August is therefore a retreat from a July high that was itself partly a diversion effect, rather than necessarily from an underlying recovery. Six sampled months cannot separate the two.
Lloyd’s List Intelligence recorded 354 Bab el-Mandeb passages in the week to 19 July and 269 in the week after the blockade, a 24% decline. That count includes modelled dark transits; a separate AIS-enabled count is the closer comparison to ours. Their baseline week falls inside the same diversion window, so both measure a fall from an inflated base.
The two series are not identical in definition. Our extract is limited to cargo and tanker AIS types meeting our size filter, we do not model vessels transiting without AIS, and a single network will not see every vessel. Despite those differences the percentage change over the same blockade-week window is very similar: 23% in our data against 24% in theirs. The 18% on our cover is a monthly average, not the same comparison. We use the series to compare changes rather than as a total traffic count.
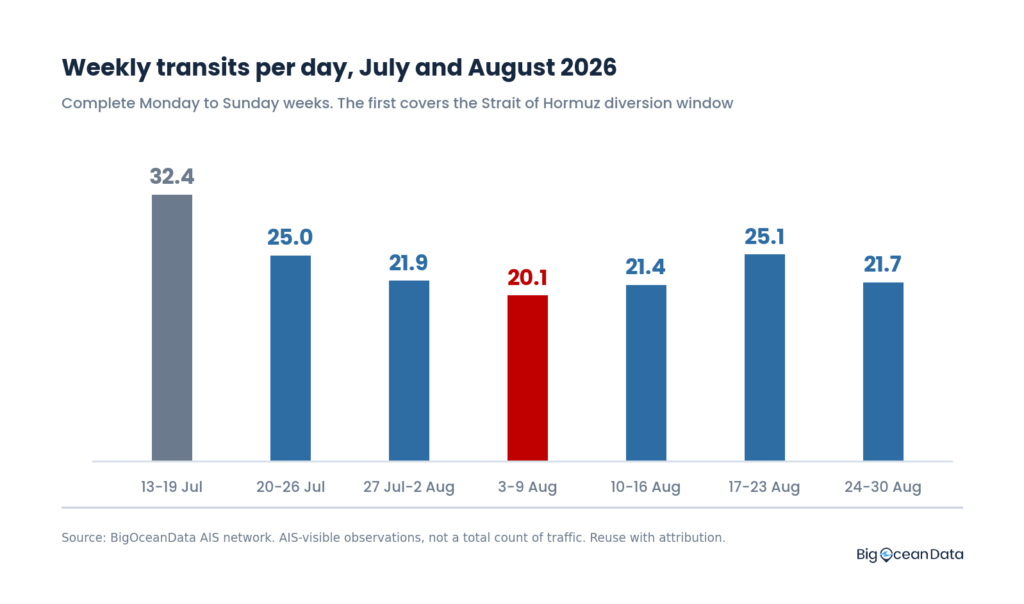
Our complete weekly series, Monday to Sunday, runs 32.4 a day in the week to 19 July, then 25.0, 21.9, 20.1, 21.4, 25.1 and 21.7 in the week to 30 August: a trough in the week to 9 August, recovery in the week to 23 August, then easing back. The August average of 21.7 conceals that shape, with 20.0 a day in the first half of the month and 23.6 in the second.
Weekly transits per day, complete Monday to Sunday weeks.
An older, differently flagged fleet is using the route
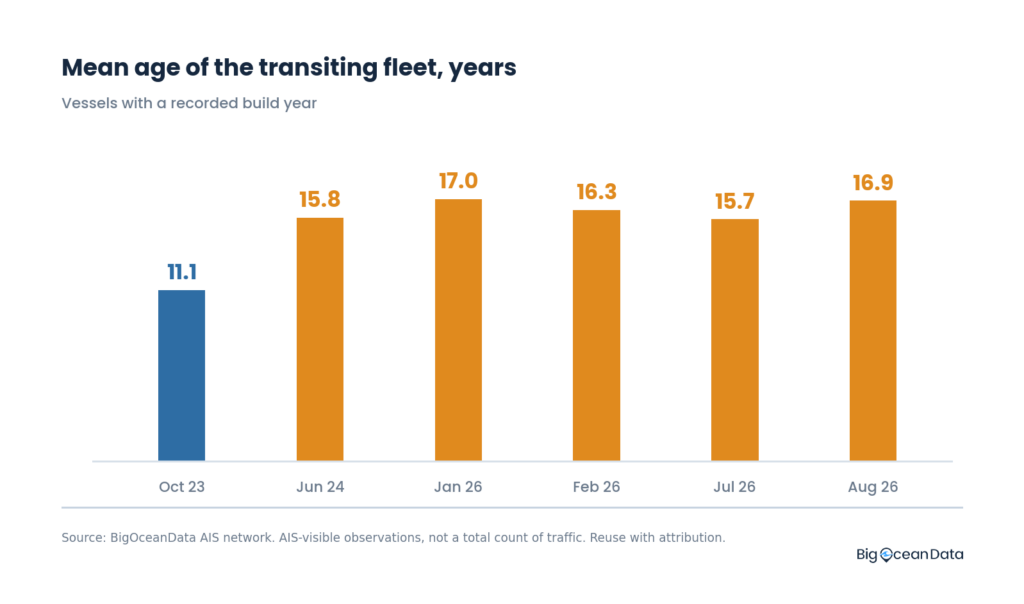
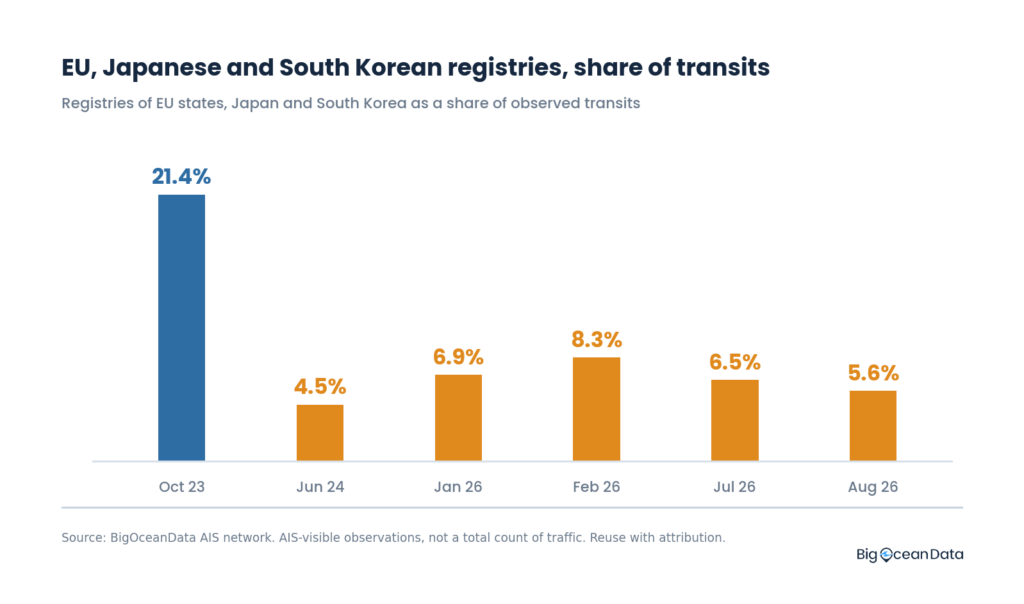
The composition of the fleet has changed sharply since 2023. Mean age stepped up from 11.1 years to 15.8 between October 2023 and June 2024 and has held in a 15.7 to 17.0 band since, reaching 16.9 in August. The share of transits by vessels over twenty years old has gone from 10.9% to 32.6%, and registries of EU states, Japan and South Korea from 21.4% of transits to 5.6%.
These are proportions within the transiting fleet, so they describe who sails the route rather than how many. They are measured by flag of registry rather than beneficial ownership: a Greek-owned ship flying Malta counts as Maltese here.
Where the share went
Open registries did not absorb that share as a category: they were already 71.9% of transits in October 2023 and are 75.4% now. It went instead to a small number of specific registries. Russia rose from 3.6% of transits to 7.9%, China from 1.3% to 5.2% and Sierra Leone from 1.4% to 4.7%, while Malta fell 4.3 points, Singapore 2.5, and Japan, South Korea and Norway to almost nothing.
Tankers drove most of the July–August decline
Tankers make up between half and just over three fifths of transits throughout, and account for most of the July to August fall: 3.3 of the 4.7 transits a day. On seven-day windows, tanker transits run 20.7 a day in the peak week of 13 to 19 July and 13.3 in the week after the blockade, and 12.0 a day across August on our own monthly average.
Week on week, that is a 36% fall from the peak week to the week after the blockade, against 23% for the transiting fleet as a whole over the same two weeks. The retreat after the blockade is concentrated in tankers and substantially exceeds the decline in the wider fleet.
Major-line vessels have thinned faster than the rest
Two measures point the same way. The simpler is observed presence: major-line vessels made up 22.4% of the cargo and tanker vessels we observed within 1,200km of the strait in October 2023, against 6.8% in August 2026. Over that period the total observed in the corridor fell from 1,776 to 1,004, while observed major-line vessels fell from 397 to 68. That share is stable as the detection bar rises, moving less than a point in October and about a point in August between a one-observation and a fifty-observation minimum, so it is not an artefact of how often we see them. We treat it as directional rather than as a census of the physical fleet.
The second is propensity: of the major-line vessels we observed well enough to judge, what share actually crossed. At a 1,200km corridor radius that is 90% before the campaign, against 38% to 75% across the five months since, with February 2026 the highest of them. Small denominators and sensitivity to corridor width mean we report that one only as a range, with the full sensitivity figures in the methodology. The presence measure does not use that threshold.
Both count only hulls carrying a line’s own name, so chartered tonnage trading for those lines under other names is outside them, and neither measures the scale of carrier activity. We make no claim about any individual carrier. Others measuring carrier activity rather than hull names report container lines returning to the route, and both can be true at once.
Protective AIS messaging rose among the same ships
The clearest behavioural evidence comes from holding the fleet constant. 153 vessels transited Bab el-Mandeb in both January and August 2026. Among that identical set, the share broadcasting a protective message in the AIS destination field rose from 14.4% to 31.4%. Of those 153 vessels, 32 began broadcasting protective messages and 6 stopped. A two-sided exact sign test on that split gives p = 0.000024.
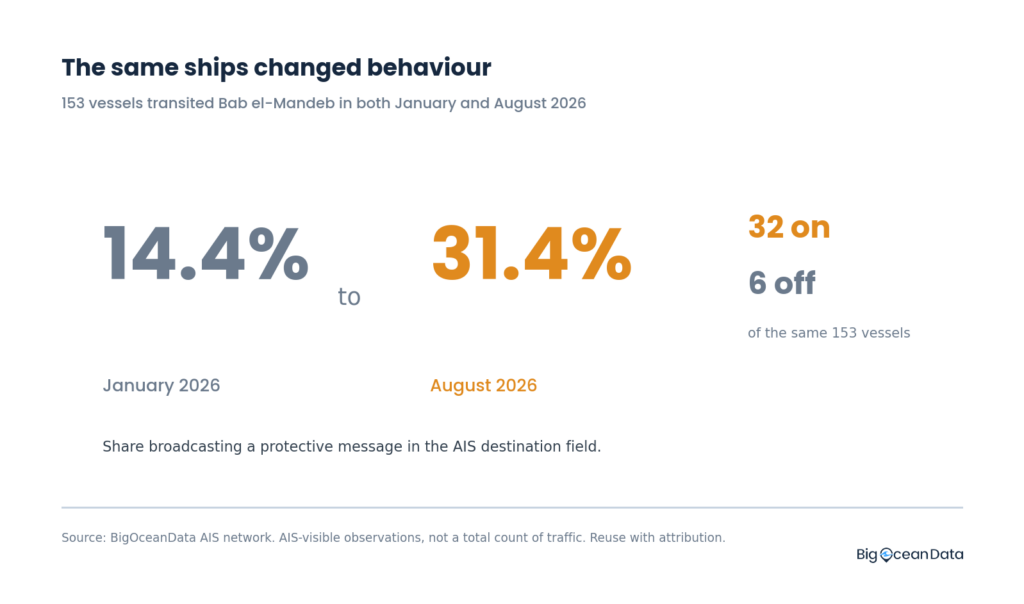
Because the cohort is fixed and restricted to vessels that actually transited the strait, this cannot be explained by a change in which ships use the route. It is the same vessels behaving differently.
Across the whole transiting fleet the overall protective-message rate was not at a record. June 2024 was higher, at 41.2% of transiting vessels against 32.0% in August 2026, and crew-nationality or Israel-denial messaging was also higher then, at 27.3% against 22.1%. What the fixed cohort shows is not an all-time peak but that individual ships became materially more likely to signal between January and August.
What they write where the AIS destination should be
The AIS destination field is free text typed by the crew, and its intended use is the next port of call. Ships in the southern Red Sea use it instead to broadcast who they are and who they are not connected to. Some of this followed explicit advice: in January 2024 the senior Houthi figure Mohammed Ali al-Houthi urged ships with no Israeli connection to say so publicly when crossing the Red Sea. Armed-guard notices are also used as an anti-piracy measure and predate the Houthi campaign.
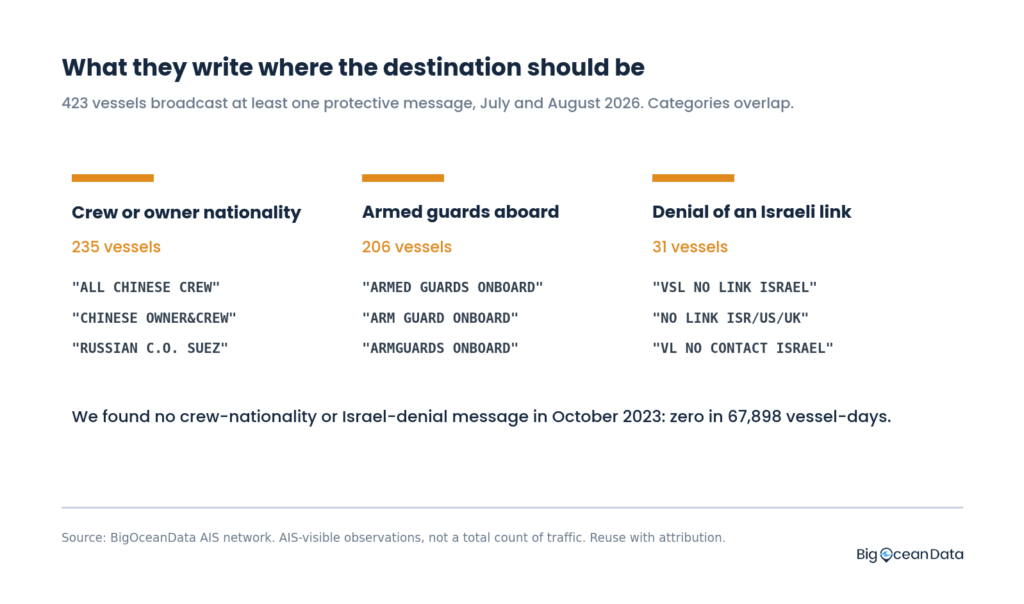
423 vessels broadcast at least one protective message in July and August 2026, across 4,641 message-carrying vessel-days. Categories overlap: a ship may broadcast more than one type. In October 2023 we found no crew-nationality or Israel-denial message: zero in 67,898 vessel-days.
Saudi destinations vanish from the broadcasts
On 20 July 2026 the Houthis declared a maritime blockade of Saudi shipping. Splitting July at that date gives the sharpest single change in this dataset.
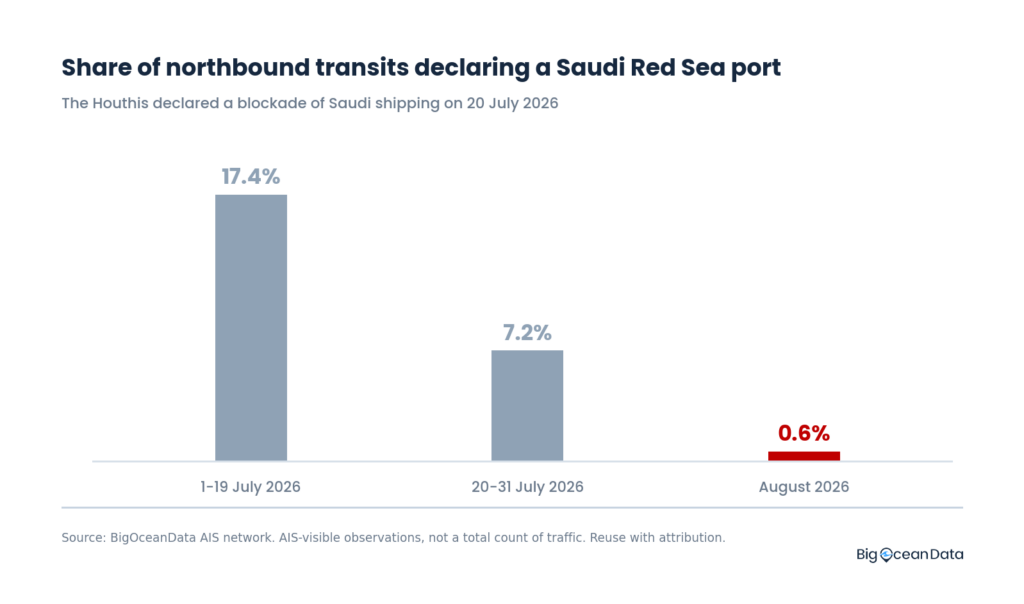
Blockade declared 20 July 2026. Denominators 258, 153 and 355 northbound transits.
This is a statement about declarations, not trade. Kpler reports every Yanbu cargo loaded since 23 July lacked continuous AIS coverage, and Vortexa says recent Yanbu loadings were conducted dark throughout. Reuters reports tankers switching AIS off to avoid attack. Our measure and theirs are two views of the same behaviour: Saudi-linked trade has become much less visible on AIS.
The blockade also changed the insurance environment. War-risk underwriters tightened terms for Saudi-linked Red Sea voyages within days of the announcement, and later arrangements restricted some Saudi-linked tonnage further. That may have contributed to the fall in Saudi-linked traffic. Our measure cannot separate insurance-driven routing from vessels reducing their public exposure, and a line of text in the AIS destination field is not the instrument on which cover is written. What the data shows is that ships largely stopped saying they were going to Saudi Arabia. Whether they stopped going is a separate question.
Other tests, what did not change
We also tested three propositions that did not hold, and report them because their absence is as informative as the findings above.
No within-vessel speed change. Aggregate speed at the gate falls from 14.3 to 13.0 knots. Among the 96 ships present in both periods it is 12.83 and 12.86. The aggregate fall is fleet mix.
No lane shift. Cross-channel position at the narrows differs by less than 0.01 degrees between October 2023 and August 2026.
No detectable response to the 11 August attack. Protective messaging ran at 5.5% of a mean 1,451 ships present each day across 1 to 10 August, 6.1% on the 11th, then 5.3% and 4.9%. The Tihamah itself, at about 63 metres and Tanzania-flagged, falls outside our size filter. No significance test was applied and a small response would not show.
Methodology
Data
Six month-long extracts from the BigOceanData AIS network: October 2023, June 2024, January, February, July and August 2026. Position data comprises MMSI, timestamp in UTC, latitude, longitude, speed and course over ground, reported draught, navigational status and a terrestrial or satellite source flag. Separate files supply vessel particulars and one destination record per vessel per day. The months were chosen to bracket the campaign: October 2023 immediately before it, June 2024 at its height, January and February 2026 during the Gaza ceasefire, and July and August 2026 around the Saudi blockade. The United States and Israel struck Iran on 28 February 2026 and the Houthis signalled that attacks on shipping would resume. Both January and February are therefore effectively pre-Iran-war months, February capturing only its final day, which is consistent with February showing no comparable spike. Comparisons drawn between January and August span both the war and the blockade and cannot separate them.
Geography
All six months cover 10N to 26N and 34E to 46E, plus 10N to 20N and 46E to 58E, so every comparison in this report is drawn on identical geography.
Vessel filter
AIS cargo and tanker types of 10,000 DWT or more, or 100 metres or longer. Where both particulars are unrecorded, a vessel is included if its median reported draught is 7 metres or more. Tested against the 7,295 vessels in these extracts that do have both particulars recorded, and against the same deadweight-or-length rule used for inclusion, the draught proxy has a precision of 99.5%, a recall of 88.6% and an overall accuracy of 88.7%. It admits very few vessels that should be excluded, at the cost of missing some that should be included. Since missing particulars are far more common in 2026 than in 2023, that bias reduces qualifying 2026 vessel counts rather than inflating them with small ships.
Transits
A transit is a change of side across a gate defined in code, perpendicular to the observed traffic axis through Perim Island on a bearing of 126 degrees. Positions within 60km of the gate are discarded and a transit is recorded when a vessel’s remaining positions change side. The count therefore requires no observations at the narrows or inside the degraded terrestrial-coverage band, which matters where reception is poor or vessels are transiting dark; a vessel unobserved across the whole passage is still missed. Where gate coverage is good it agrees with a conventional gate-crossing method within 3%, and where coverage is poor it recovers crossings that the conventional method loses.
Major-line vessels
Vessels whose name matches one of sixteen major container line naming conventions, which identifies owned tonnage carrying a line’s own name; chartered ships under unrelated names are not captured. Observation intensity varies substantially between months, so absolute vessel counts should not be treated as a longitudinal census. The presence comparison therefore uses the share of observed corridor vessels, which is stable across detection bars from one to fifty observations. For crossing propensity we apply an additional threshold and report the share that crossed among vessels observed at least 100 times within a fixed radius of the strait. A 1,200km radius reaches Jeddah and Socotra while excluding Fujairah and the Gulf of Oman. At the 1,200km radius the six months read 90%, 38%, 58%, 75%, 41% and 58%, on denominators of 364, 39, 36, 36, 56 and 31 vessels. That fall in the denominator has two causes: far fewer major-line vessels are present in the corridor at all, 397 in October 2023 against 68 in August 2026, and a smaller share of those present clear the hundred-observation threshold, 92% against 46%.
Protective messages
Destination strings classified by pattern matching into three overlapping categories: crew or owner nationality, armed guards aboard, and denial of an Israeli link. Three denominators appear in this report and are not interchangeable. The monthly table rows use vessels that transited in that month. The fixed-cohort figure uses only the 153 vessels that transited in both January and August 2026. The short-window August test uses vessels present in the study area during each stated period. The classification rules were written for this analysis and have not yet been independently reviewed.
Coverage
The southern Red Sea between approximately 12N and 19N is an area of degraded terrestrial AIS reception, and vessels there are observed mostly by satellite. Our trough week, to 9 August, carries the caveat that a low AIS-visible count can reflect more ships going dark rather than less traffic. All counts are AIS-visible observations from a single network and are not a total count of traffic. Independent trackers differ widely on the same waters: for the week beginning 3 August 2026, Vortexa, Kpler and AXSMarine estimated Yanbu loadings at 2.38 million, 1.78 million and 850,000 barrels a day respectively.
How the measurements are defined
The gate runs perpendicular to the observed traffic axis through Perim Island on a bearing of 126 degrees. Positions within 60km of it are discarded and a transit is recorded when a vessel’s remaining positions change from one side to the other, so the count needs no observations inside the strait itself. The shaded band is the area of degraded terrestrial AIS reception. The rings show the corridor radii used to define which major-line vessels count as working these waters.
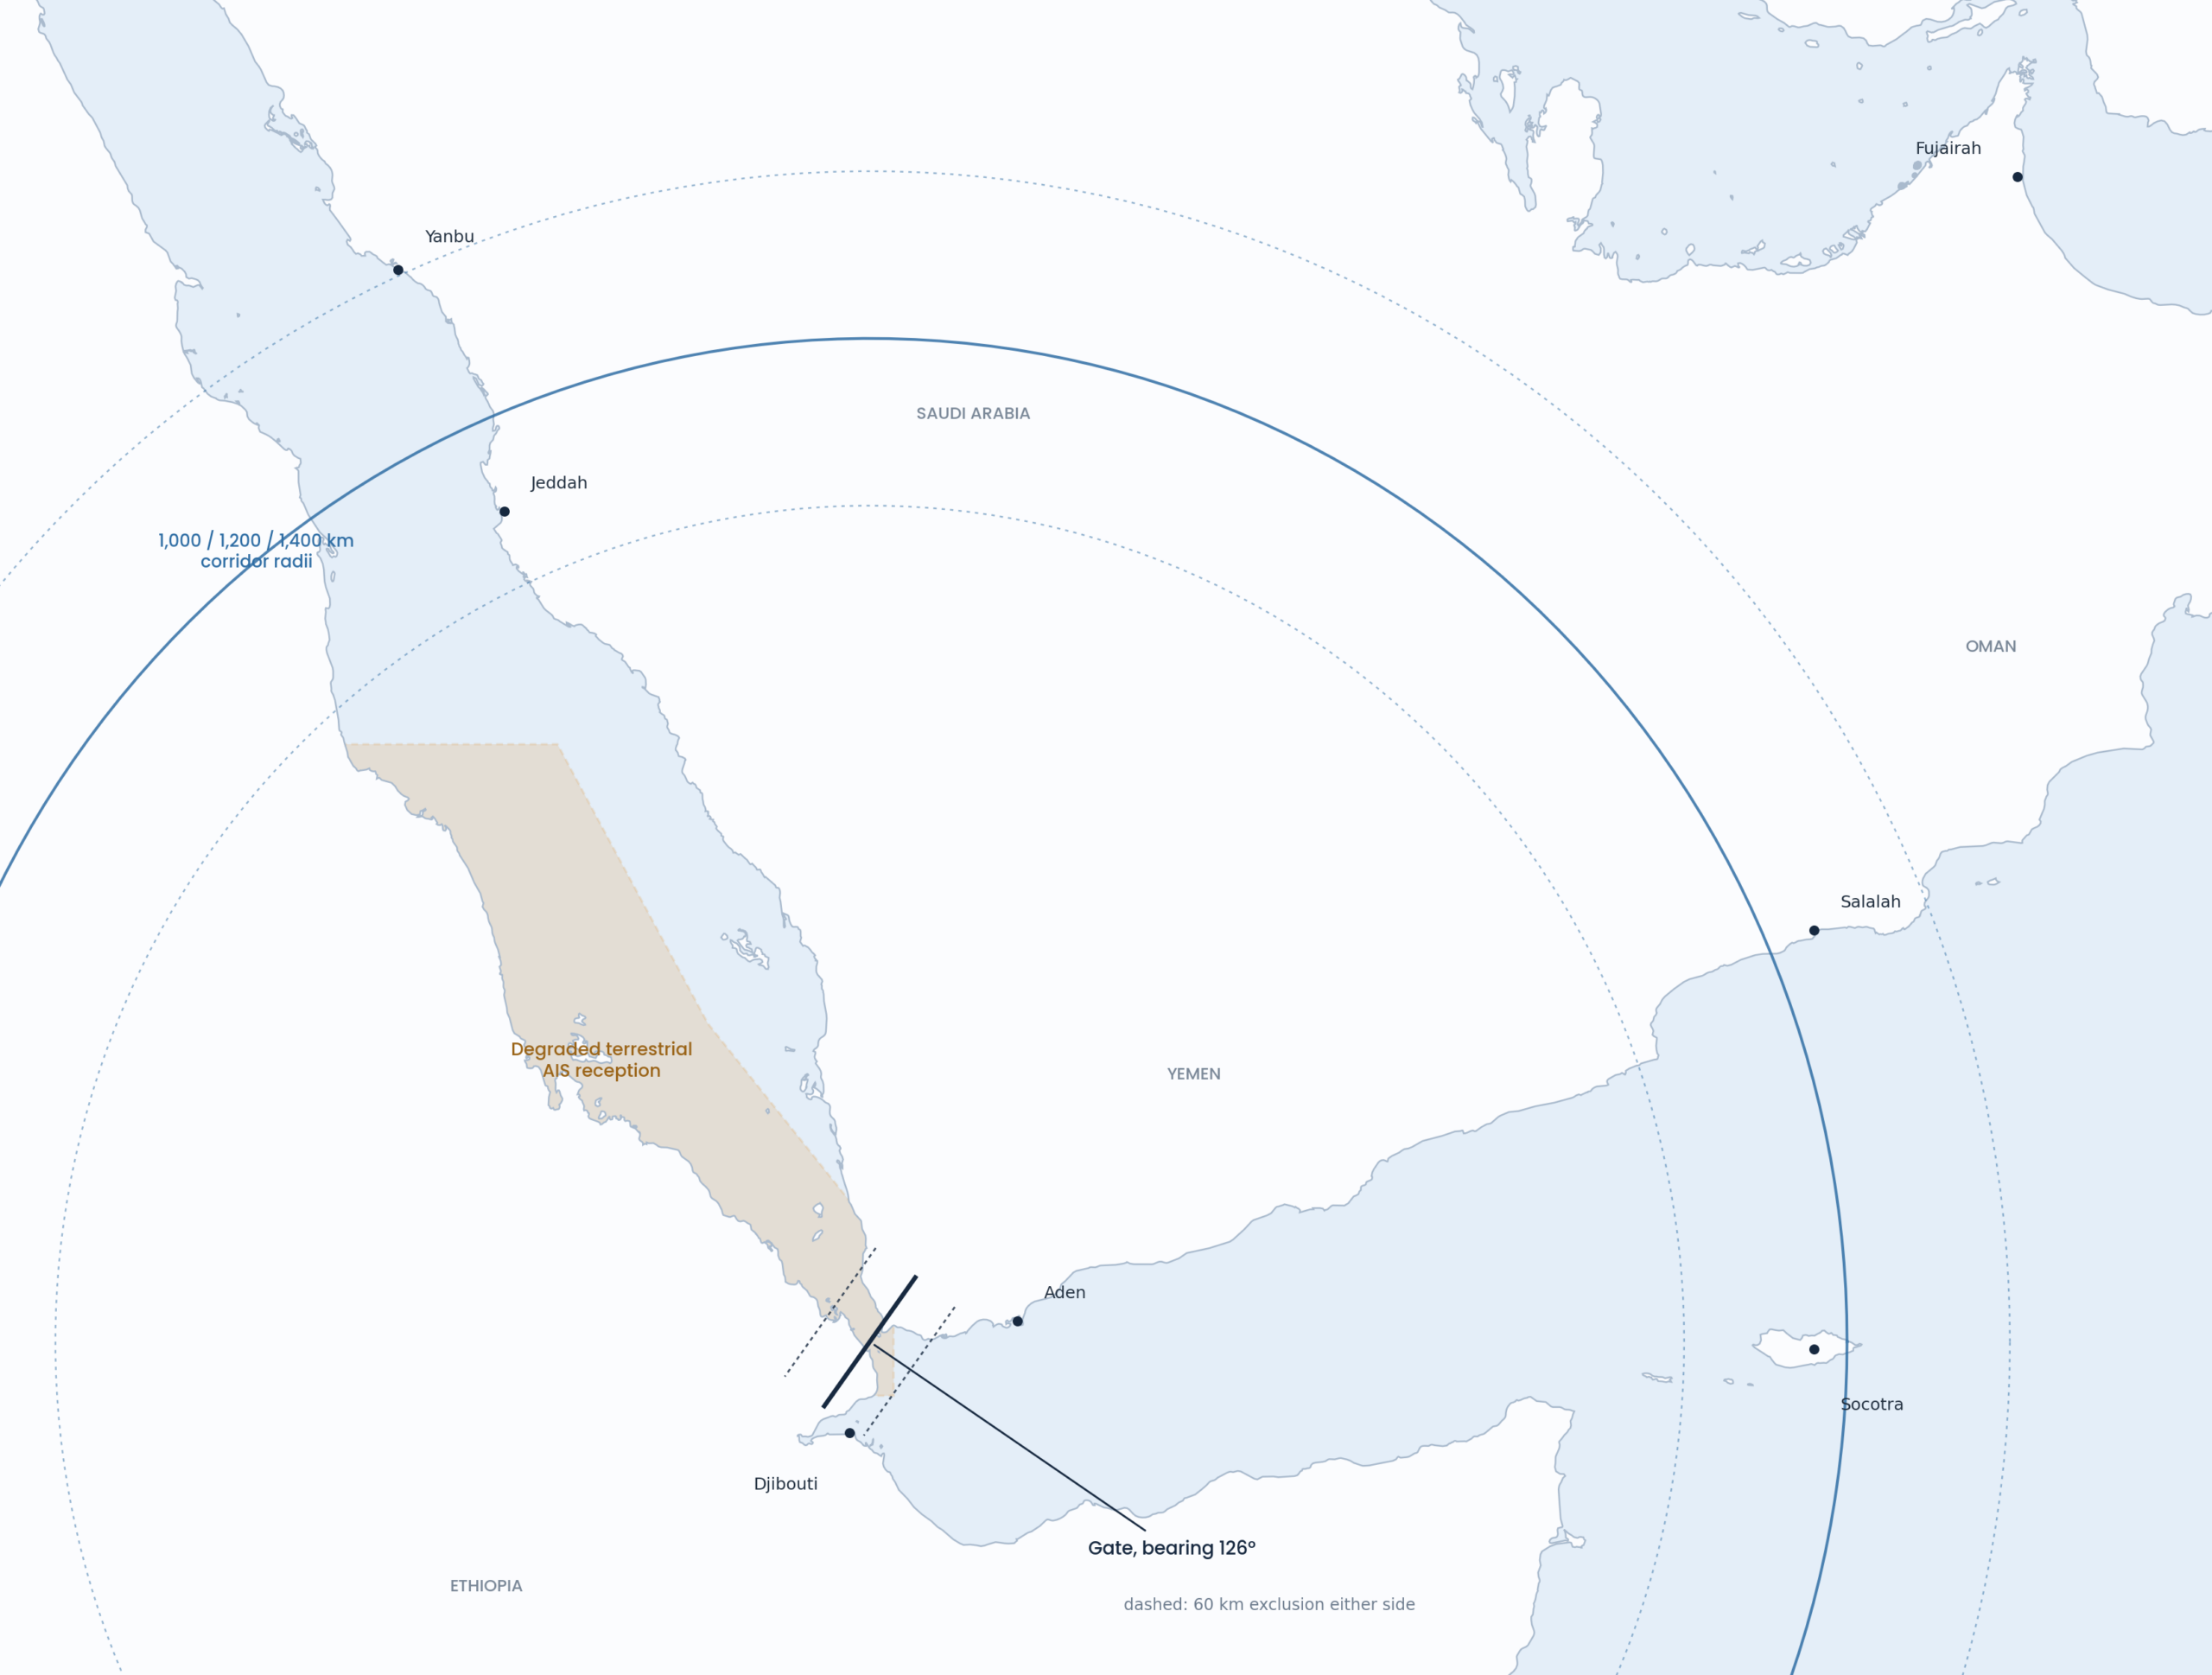
BigOceanData 2026. Coastline from Natural Earth.
External sources cited for context
All quantitative findings and analysis in this report are from BigOceanData unless otherwise stated. The sources below are cited only for external context and comparison.
1. Lloyd’s List Intelligence, for the independent Bab el-Mandeb passage counts, the Strait of Hormuz diversion effect, and the war-risk insurance response to the July blockade.
2. Reuters, for the Tihamah attack.
3. Reuters, citing Vortexa, Kpler and AXSMarine, for Saudi-linked AIS-dark behaviour and divergent loading estimates.
4. Mohammed Ali al-Houthi, public statement of January 2024, for the advice to declare no Israeli connection.
Download our research report
Get the complete BigOceanData analysis, including the findings, charts, methodology and frequently asked questions.
About BigOceanData
BigOceanData is a UK-based vessel tracking and maritime intelligence platform, processing over 80 million AIS position reports a day across more than 450,000 vessels and 4,500 monitored ports. The platform provides satellite and terrestrial AIS tracking, zone monitoring and alerting, route optimisation and multi-year track history to fleet operators, insurers, security firms and government bodies. Clients include Maersk, Crisis24 and Cory Brothers.
Journalists and analysts are welcome to reuse the charts and figures with attribution. Contact us for supporting aggregates and methodology.
Contact
Media enquiries:
Wail Sabbagh, Commercial Director, +44 (0)7782 325414, wail.sabbagh@bigoceandata.com