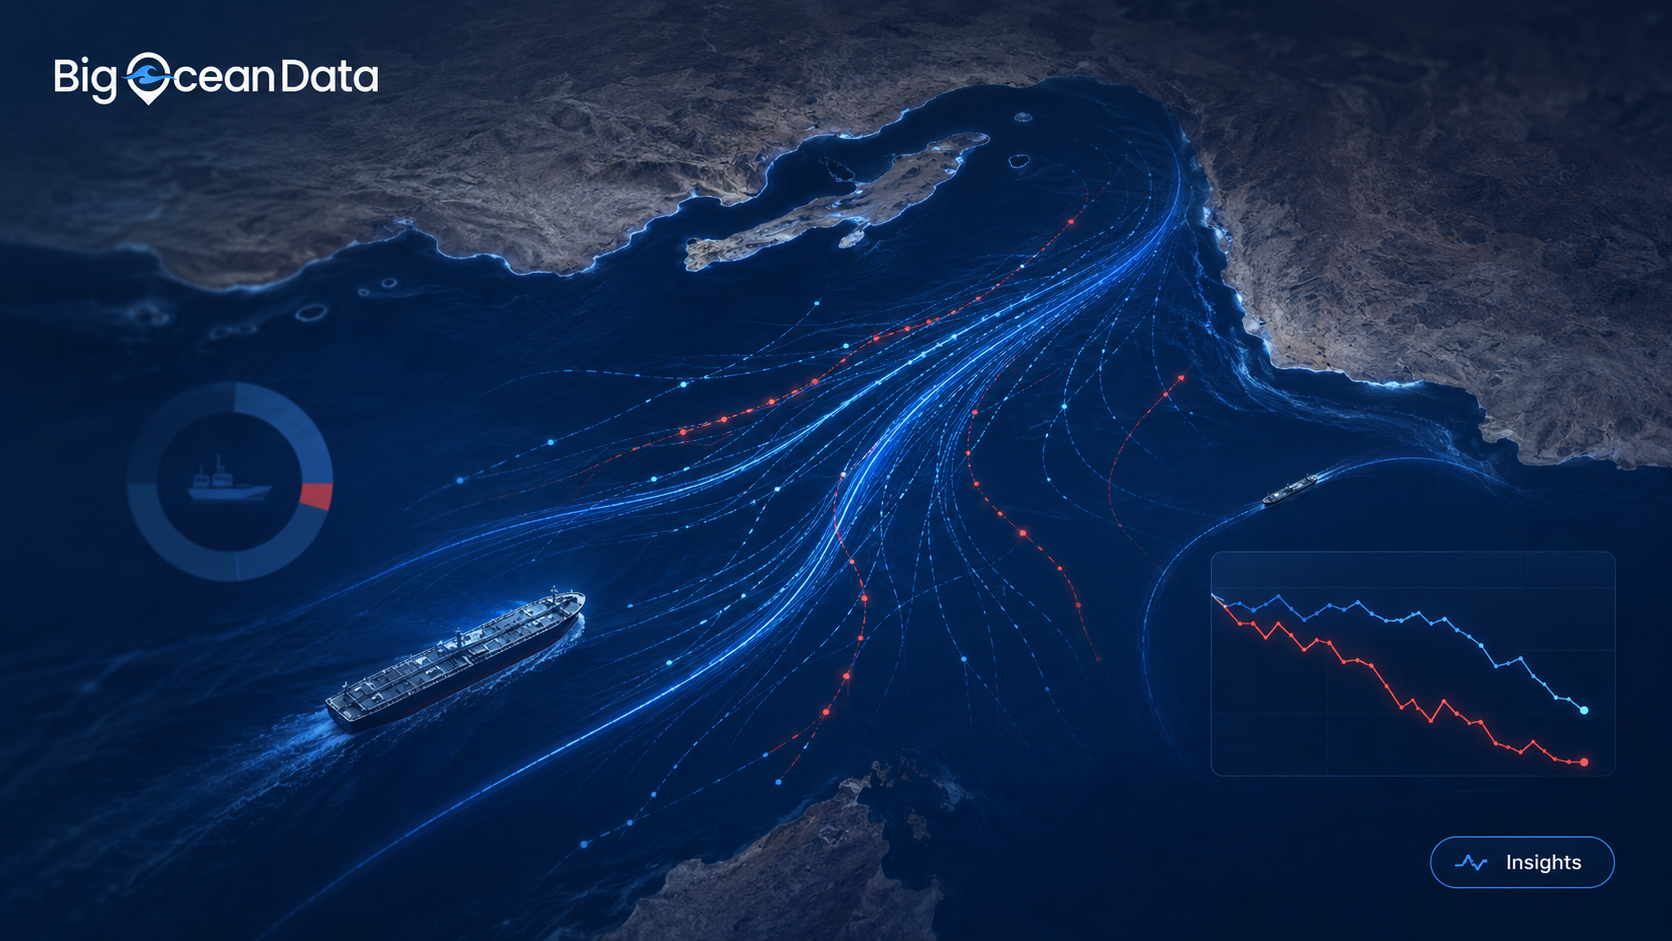


BigOceanData monitored Strait of Hormuz vessel traffic for 30 days, analysing every qualifying cargo ship and tanker observed across the strait and its approaches. The results reveal a maritime corridor operating far outside its normal patterns.
On a normal day, the Strait of Hormuz is one of the world’s busiest energy corridors. In January, our AIS network, which monitors more than 450,000 vessels worldwide through satellite and terrestrial sources, recorded an average of 79 transits a day by cargo and tanker vessels over 10,000 DWT. That is equivalent to one vessel every 18 minutes through a waterway that carries more than a quarter of global seaborne oil trade.
During the 30-day crisis window from 15 June to 15 July, the average fell to 14.5 visible transits a day, an 82% decline. Nine days saw fewer than ten qualifying vessels complete the passage. On 13 July, the quietest fully observed day, we recorded two.
Key findings: 30 days in the Strait of Hormuz
| 82% | collapse in daily strait transits (79/day in January → 14.5/day) |
| 2 | large-vessel transits on 13 July, the quietest fully observed day (January minimum: 60) |
| 49% | of strait vessels showed 3h+ AIS gaps, vs a 20% January norm – 57% in the final week |
| -94% | final-week fall in daily tanker carrying capacity vs the same week in January (6.6M DWT/day to 0.4M) |
| 75% | of first-week transits switched to the Iranian side of a strait that is normally 99.9% Omani-side |
| +54% | rise in Iranian-flagged vessels present, while the overall fleet shrank by a third |
Across the analysis window, we observed 1,426 qualifying cargo and tanker vessels in the strait and its approaches, 34% fewer than the 2,176 observed during January. The traffic that remained was also slower, less consistently visible and distributed across markedly different routes.
The picture, drawn in light
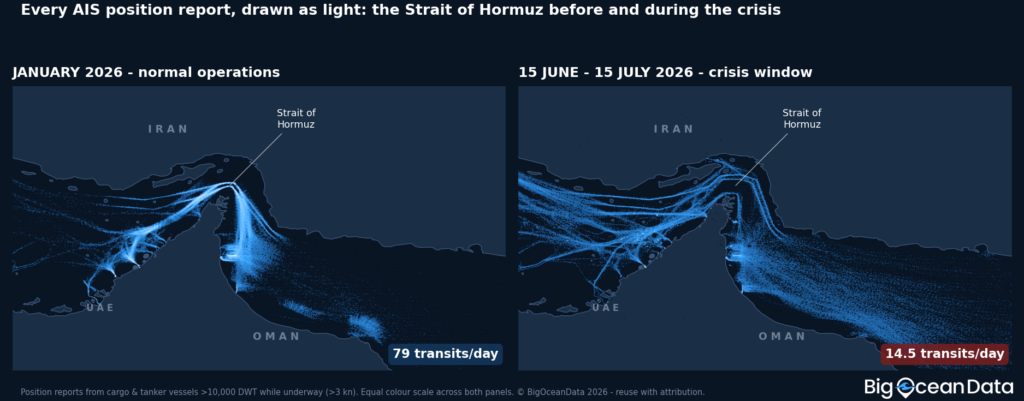
Every dot of light is a position report from a large vessel underway, and what changes between the panels is not the amount of light so much as its shape. In January the traffic is disciplined: the strait’s separation lanes burn as one continuous, concentrated band. In the crisis window that order dissolves. The band frays into competing strands, including routes on the Iranian side, traffic scatters across improvised paths in the western Gulf, and a widening sprawl of slow and waiting vessels spreads through the Gulf of Oman. Fewer ships are completing the passage, and the ones still out there are moving in far less predictable ways.
24 hours in the Strait of Hormuz: a normal January day versus 13 July, the quietest fully observed day. Bright dots are vessels underway; dim dots are vessels at anchor. © BigOceanData 2026.
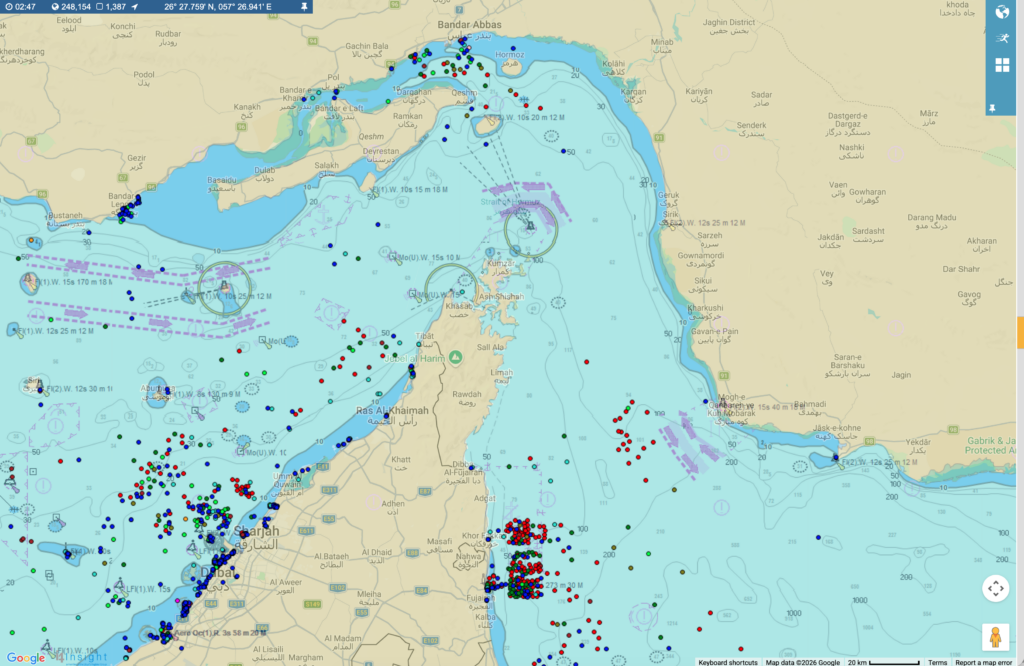
The BigOceanData operational view of the strait on 15 January 2026, with 1,517 vessels on screen.
The collapse, day by day
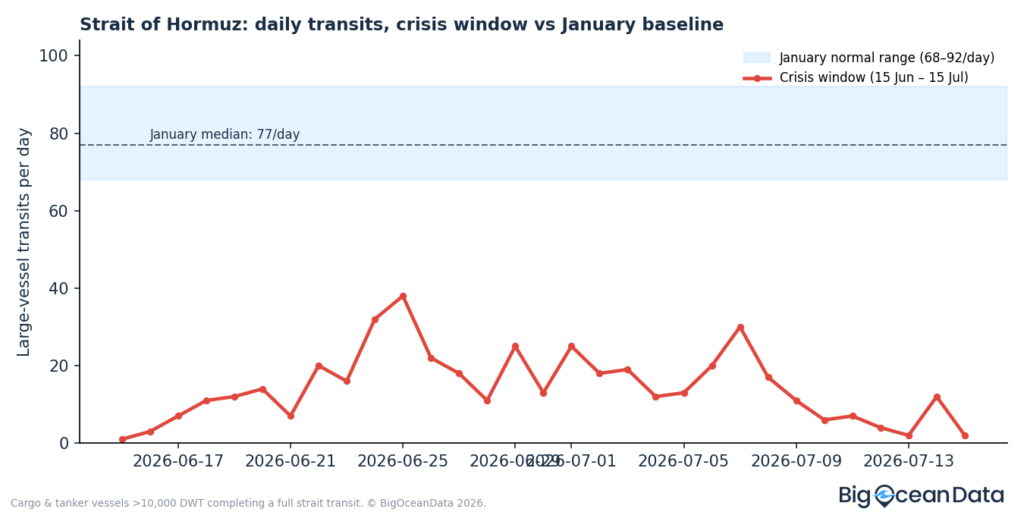
Traffic through the second half of June ran at a fraction of normal and kept deteriorating: the final full week of our window averaged just 6.3 transits a day against a January median of 77. The ships still making the passage take longer over it – median time inside the strait zone rose from 6.9 hours in January to 9.2 hours, a 33% increase consistent with convoy timing, waiting on escorts, and cautious routing.
Translate hulls into carrying capacity and the energy-market scale becomes clear. In January, tankers moving through the strait represented 5.8 million DWT of carrying capacity every day. Across the crisis window that fell to 1.1 million DWT/day – and in the final week, 0.4 million, a 94% reduction against the same week’s January equivalent. DWT measures vessel carrying capacity, not barrels actually loaded or delivered; we count the ships, not their manifests. But as a measure of how much of the world’s tanker fleet is still willing to run the strait, the collapse is unambiguous.
Half the fleet became intermittently invisible
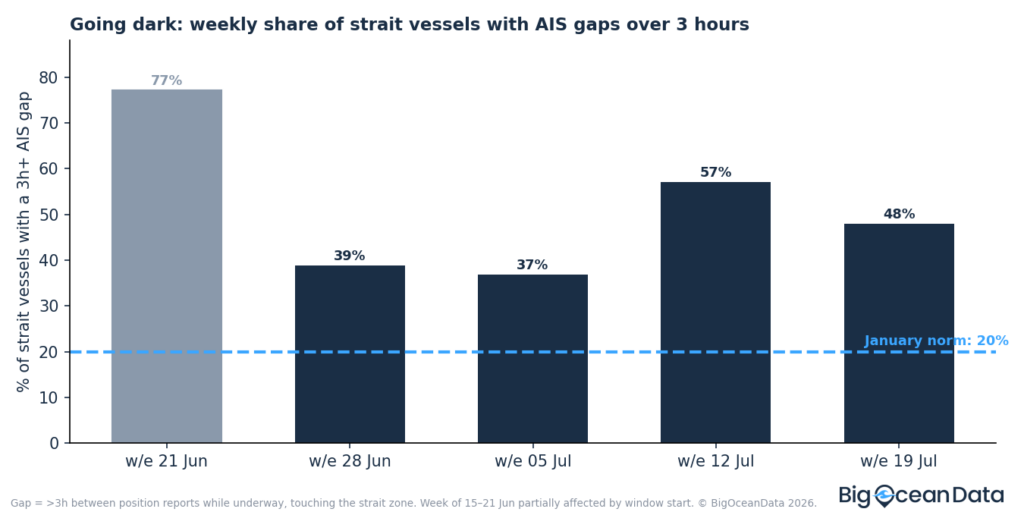
Headline transit counts understate what’s actually moving, because vessels are going dark, whether by suspending transmissions or dropping out of coverage, at extraordinary rates. Some level of signal gap is normal – in January, 20% of vessels in the strait zone showed at least one gap of three hours or more on a given day. In our crisis window that figure averaged 49%, and in the final full week it reached 57%. Half the ships in the world’s most important oil chokepoint are now intermittently invisible; 223 Of the 1,194 gap events logged, 223 lasted more than 12 hours, long enough in principle for a vessel to complete a typical transit without being visible.
Dark gaps are no longer confined to sanctioned tonnage; the pattern is consistent with dark transiting becoming a mainstream strategy, although AIS data alone cannot prove intent for any individual vessel. Going dark may also create new risks: in the current crisis, vessels accused of violating routing or reporting requirements have been publicly treated as enforcement targets.
The corridor shuffle
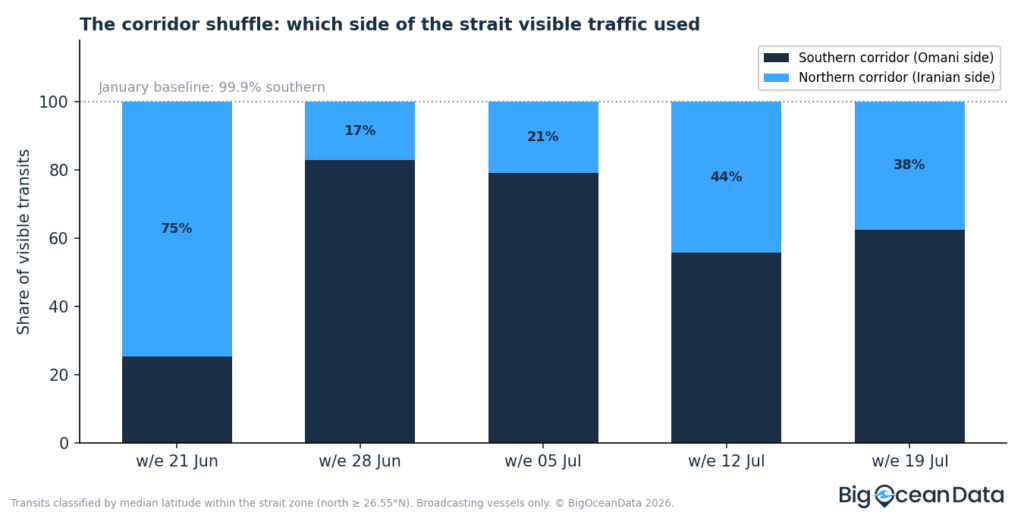
In January, corridor choice wasn’t a question: 99.9% of transits used the southern lanes on the Omani side. In the first week of the crisis window that inverted almost completely – three quarters of visible transits hugged the Iranian side of the strait. Traffic drifted back south through late June, but the southern share never returned to normal, and by mid-July the fleet was split roughly 60/40.
At first glance, that shift looks counterintuitive. Iran has demanded that shipping use a route through its territorial waters, and vessels using the internationally backed Omani-side lane have been attacked; for many operators, compliance with the Iranian routing regime appears to have become the safer option. The composition of the fleet reinforced the shift: with much of the commercial fleet standing off, the traffic that remained in the early weeks skewed toward Iran-linked tonnage that uses Iranian waters as a matter of course. The later drift back south tracks the organisation of escorted convoys on the Omani route. Our AIS data measures the shift itself; the motives are drawn from public reporting. The weekly split shows how operators changed route as the security situation developed.
Waiting, and trading outside the gate
The Gulf of Oman approaches now behave differently too. Anchoring events per vessel doubled – 1,991 anchor episodes across 2,176 vessels in January versus 2,749 across just 1,426 vessels in the crisis window – a pattern of repeated stop-wait-reassess behaviour rather than the single scheduled anchorage call of normal operations. Probable ship-to-ship transfer events (vessel pairs within 500 metres of each other for four-plus hours) ran 22% above baseline, peaking in the week of 22–28 June at roughly double the January weekly rate – consistent with cargoes changing hands outside the strait so fewer hulls have to run it.
One more shift stands out in the flag data: while the overall fleet shrank by a third, the number of Iranian-flagged vessels in these waters rose by more than half (57 to 88, per vessel registry data), taking their share of regional traffic from 2.6% to 6.2% and lifting Iran from the eighth most common flag in these waters to the fourth.
What this means if you operate, insure or trade
For operators, insurers and traders, the main implications are straightforward. First, visible-traffic counts now materially understate real activity – any exposure model built on broadcast AIS alone is wrong in a specific, measurable direction. Second, gap history has become a primary screening signal: with half the fleet running dark, when and where a vessel goes silent matters as much as its ownership. Third, the behavioural shifts – corridor switching, repeat anchoring, elevated STS activity – are the patterns that persisted for months after the Red Sea crisis normalised them; expect the same here.
Methodology
Analysis covers all cargo and tanker vessels over 10,000 DWT (AIS types 70–89) within a bounding box spanning the Persian Gulf approaches, the strait, and the Gulf of Oman (23–28.5°N, 53–61°E), 15 June–15 July 2026, against a 1–31 January 2026 baseline: The underlying extract comprises 3.4 million position reports from more than 5,000 unique vessels at roughly 15-minute sampling; the filtered analysis set used here contains 1.8 million reports from the vessels meeting the size and type criteria. The first and last days of each window are excluded from day-level superlatives, as transits spanning a window boundary cannot be fully observed.
A transit is a vessel crossing the strait zone from one side to the other within 48 hours. A dark gap is >3 hours between position reports while underway, touching the strait zone – the 20% January baseline reflects normal coverage variation in a terrestrial-dominant feed, which is why we report the change against baseline rather than treating every gap as deliberate. Corridor classification uses median latitude within the strait (≥26.55°N = northern).
Tanker capacity figures sum the deadweight tonnage of tankers completing transits; they measure fleet capacity willing to transit, not cargo volumes. Flag states are assigned from vessel registry data covering 99.8% of the analysed fleet. Density maps plot underway position reports (>3 knots) on an equal colour scale. Position data is drawn from BigOceanData’s global AIS network, which combines terrestrial receiver coverage with satellite AIS from low Earth orbit constellations. Identical filters, thresholds and geographic definitions were applied to both analysis windows, so every comparative figure in this piece measures change against a like-for-like baseline.
Download our research report
Get the complete BigOceanData analysis, including the findings, charts, methodology and frequently asked questions.
Frequently asked questions
Why do ships turn off AIS? Carriage rules require most large vessels to broadcast AIS, but masters may reduce or suspend transmission where they judge it necessary for security – a provision written for piracy zones that is now being applied at scale in Hormuz. Others go dark to obscure sanctioned trade. The data can show a gap; it cannot by itself prove intent.
Is sailing dark illegal? Not automatically. SOLAS permits switching off AIS when the master believes broadcasting compromises the ship’s safety. But gaps are increasingly treated by insurers, flag states and enforcement bodies as a risk marker requiring explanation – and in the current crisis, dark vessels have been explicitly framed as targets for enforcement.
How is a ‘dark gap’ detected? By absence: a vessel reporting positions stops appearing in the feed for longer than coverage variation explains, then reappears. We use a three-hour threshold and compare the results with a normal-month baseline. This does not prove that every gap was deliberate, but it shows how unusually frequent and prolonged reporting interruptions became during the crisis.
Does an 82% drop in transits mean an 82% drop in oil flow? No. Some flow continues via dark transits our visible counts miss, ship-to-ship transfers outside the strait, and larger vessels carrying consolidated cargoes. What the data measures precisely is the collapse in vessels willing to transit visibly – the strongest available proxy for how the commercial fleet is pricing the risk.
All figures derived from BigOceanData’s AIS network. Journalists and analysts are welcome to reuse the charts and maps with attribution – contact us for supporting aggregates and methodology. If you need to monitor a fleet through the strait, zone alerts and full track history are included on every BigOceanData plan.
About BigOceanData
BigOceanData is a UK-based vessel tracking and maritime intelligence platform, processing 80 million AIS position reports a day across more than 450,000 vessels and 4,500 monitored ports. The platform provides satellite and terrestrial AIS tracking, zone monitoring and alerting, route optimisation and multi-year track history to fleet operators, insurers, security firms and government bodies. Clients include Maersk, Crisis24 and Cory Brothers.
Media enquiries:
Wail Sabbagh, Commercial Director, +44 (0)7782 325414, wail.sabbagh@bigoceandata.com